What Metrics are included in the Tenjin Dashboard?
The Tenjin dashboard allows app developers to quickly access common analyses that marketers use to make decisions. The following video explains how we calculate some cohorted and non-cohorted metrics at Tenjin.
Now you can hover over the metric name at the top of the columns in the dashboard to learn the metric definition and the formula.
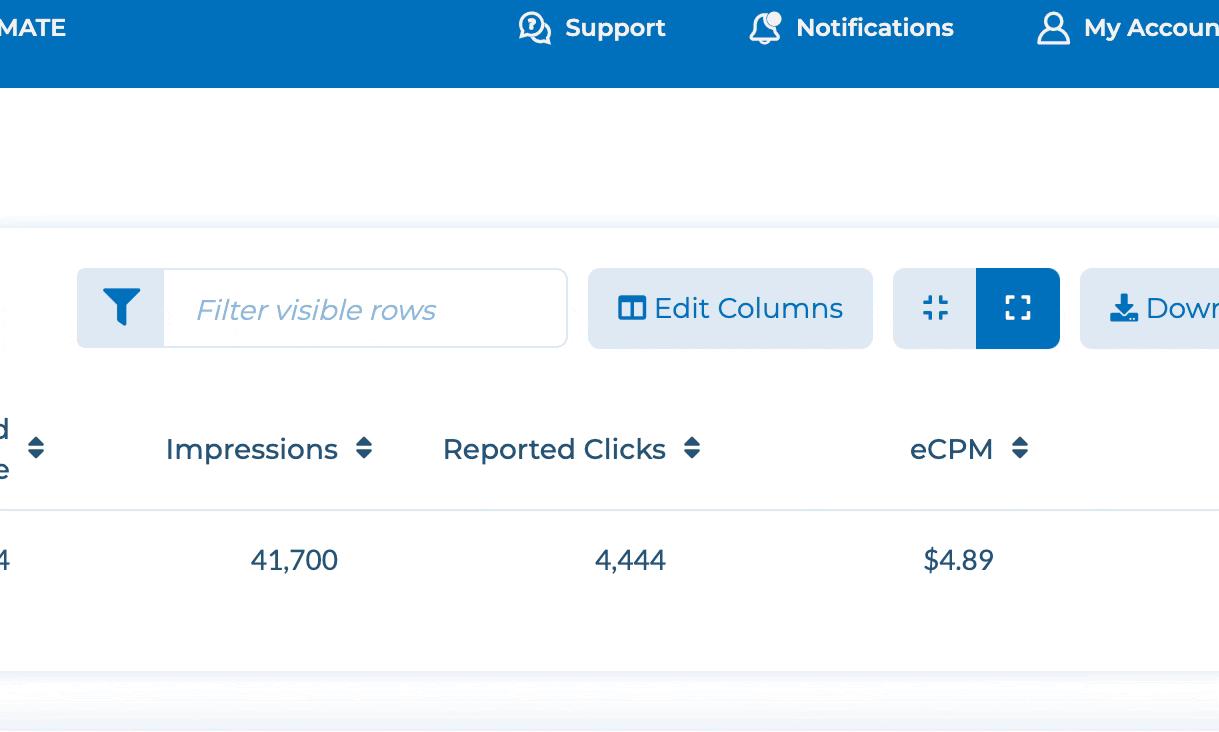
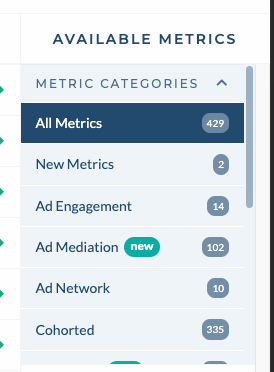
You can explore metric categories under the Edit Metrics tab to quickly find and organize all available metrics with ease.
Below is a complete list of metrics and common cohorts available in the Tenjin dashboard.
List of metrics
Show more
User-Acquisition Metrics
| report type | abbreviated name | full name | description |
|---|---|---|---|
| UA | IAP Rev | IAP Revenue | Total In App Purchase Amount ($) |
| UA | IAP ARPDAU | IAP Revenue Per Daily Active Users | Average amount of IAP Revenue per DAU ($) |
| UA | In App Purchase LTV | In App Purchase LTV | Average In App Purchase Amount ($) |
| UA | In App Purchase LTV / User | In App Purchase LTV / User | Average In App Purchase LTV per User Amount ($) |
| UA | N-Day IAP LTV | N-Day IAP LTV | Cumulative IAP revenue N days after install |
| UA | N-Day IAP LTV / User | N-Day IAP LTV / User | Average N-Day In App Purchase LTV per User Amount ($) |
| UA | N-Day IAP ROAS | N-Day Ad ROAS | Average N-Day ROAS Percentage (%) Amount of cumulative IAP revenue N days after install divided by spend |
| UA | N-Day IAP ROI | N-Day Ad ROI | Average N-Day ROI Percentage (%) Amount of cumulative profit (IAP revenue N days after install - spend) divided by spend |
| UA | Lifetime IAP ROI | Lifetime IAP ROI | Average In App Purchase ROI Percentage (%) |
| UA | IAP Profit Margin | IAP Profit Margin | IAP Revenue - Spend |
| UA | Ad Revenue (Ad Network) | Ad Revenue (Ad Network) | Total Ad Revenue Amount estimated by Tenjin ($) |
| UA | Ad Revenue (Ad Mediation) | Ad Revenue (Ad Mediation) | Total Ad Mediation Value ($) |
| UA | Ad ARPDAU (Ad Network) | Ad Revenue Per Daily Active Users (Ad Network) | Average amount of Ad Revenue per DAU ($) |
| UA | Ad ARPDAU (Ad Mediation) | Ad Revenue Per Daily Active Users (Ad Mediation) | Average amount of Ad Mediation Revenue per DAU ($) |
| UA | Ad Revenue LTV (Ad Network) | Ad Revenue LTV (Ad Network) | Total Ad Revenue LTV Amount estimated by Tenjin ($) |
| UA | Ad Revenue LTV / User (Ad Network) | Ad Revenue LTV / User (Ad Network) | Total Ad Revenue estimated by Tenjin per User Amount ($) |
| UA | Ad Revenue LTV / User (Ad Mediation) | Ad Mediation LTV / User (Ad Mediation) | N-Day Ad Mediation LTV per user ($) |
| UA | N-Day Ad LTV (Ad Network) | N-Day Ad Revenue LTV (Ad Network) | Cumulative ad revenue N days after install |
| UA | N-Day Ad LTV (Ad Mediation) | N-Day Ad Revenue LTV (Ad Mediation) | Cumulative Ad Mediation revenue N days after install ($) |
| UA | N-Day Ad LTV / User (Ad Network) | N-Day Ad Revenue LTV / User (Ad Network) | Average N-Day Ad Revenue LTV estimated by Tenjin per User Amount ($) |
| UA | N-Day Ad ROAS (Ad Network ) | N-Day Ad ROAS (Ad Network) | Average N-Day ROAS Percentage (%) Amount of cumulative ad revenue (Ad Network) N days after install divided by spend |
| UA | N-Day Ad ROAS (Ad Mediation ) | N-Day Ad ROAS (Ad Mediation) | Average N-Day ROAS Percentage (%) Amount of cumulative ad revenue (Ad Mediation) N days after install divided by spend |
| UA | N-Day Ad ROI (Ad Network) | N-Day Ad ROI (Ad Network) | Average N-Day ROI Percentage (%) Amount of cumulative profit (ad revenue (Ad Network) N days after install - spend) divided by spend |
| UA | N-Day Ad ROI (Ad Mediation) | N-Day Ad ROI (Ad Mediation) | Average N-Day ROI Percentage (%) Amount of cumulative profit (ad revenue (Ad Mediation) N days after install - spend) divided by spend |
| UA | Lifetime Ad ROI (Ad Network) | Lifetime Ad ROI (Ad Network) | Average Ad network revenue ROI Percentage (%) |
| UA | Lifetime Ad ROI (Ad Mediation) | Lifetime Ad ROI (Ad Mediation) | Average Ad mediation revenue ROI Percentage (%) |
| UA | Ad Revenue Profit Margin (Ad Mediation) | Ad Revenue Profit Margin (Ad Mediation) | Ad Revenue (Ad Mediation) - Spend |
| UA | Ad Revenue Profit Margin (Ad Network) | Ad Revenue Profit Margin (Ad Network) | Ad Revenue (Ad Network) - Spend |
| UA | All Revenue (Ad Network + IAP) | All Revenue (Ad Network + IAP) | All Revenue Amount (IAP + Ad Network) ($) |
| UA | All ARPDAU (Ad Revenue + IAP) | All Revenue per Daily Active Users (Ad Revenue + IAP) | Average amount of All Revenue (IAP + Ad Network) per DAU ($) |
| UA | All ARPDAU (Ad Mediation + IAP) | All Revenue Per Daily Active Users All ARPDAU (Ad Revenue + IAP) | Average amount of All Ad Revenue (Ad Mediation + IAP) per DAU |
| UA | N-Day All LTV (Ad Network + IAP) | N-Day All LTV (Ad Network + IAP) | Cumulative all revenue (IAP + Ad Network) N days after the install |
| UA | N-Day All LTV (Ad Mediation + IAP) | N-Day All LTV (Ad Mediation + IAP) | Cumulative all revenue (IAP + Ad Mediation) N days after the install |
| UA | N-Day All LTV / User (Ad Network + IAP) | N-Day All LTV / User (Ad Network + IAP) | Cumulative all revenue (IAP + Ad Network) N days after install divided by total users on 0-Day |
| UA | N-Day All LTV / User (Ad Mediation + IAP) | N-Day All Ad Mediation LTV / User (Ad Mediation + IAP) | Cumulative all revenue (IAP + Ad Mediation) N days after install divided by tracked installs |
| UA | All LTV (Ad Network + IAP) | All LTV (Ad Network + IAP) | All LTV (IAP + Ad Revenue) |
| UA | All LTV (Ad Mediation + IAP) | All LTV (Ad Mediation + IAP) | All LTV (Ad Mediation + IAP) |
| UA | All LTV / User (Ad Network + IAP) | All LTV / User (Ad Network + IAP) | All Revenue (IAP + Ad Network) per User Amount ($) |
| UA | All LTV / User (Ad Network + IAP) | All LTV / User (Ad Network + IAP) | All Revenue (IAP + Ad Network) per User Amount ($) |
| UA | N-Day All ROAS (Ad Network + IAP) | N-Day All ROAS (Ad Network + IAP) | Average N-Day ROAS Percentage (%) Amount of cumulative all revenue (Ad Network + IAP) N days after install divided by spend |
| UA | N-Day All ROAS (Ad Mediation + IAP) | N-Day All ROAS (Ad Mediation + IAP) | Average N-Day ROAS Percentage (%) Amount of cumulative Ad Mediation revenue + IAP N days after install divided by spend |
| UA | N-Day All ROI (Ad Network + IAP) | N-Day All ROI (Ad Network + IAP) | Average N-Day ROI Percentage (%) Amount of cumulative total profit (all revenue (Ad Network + IAP) N days after install - spend) divided by spend |
| UA | N-Day All ROI (Ad Mediation + IAP) | N-Day All Ad Mediation ROI (Ad Mediation + IAP) | Average N-Day ROI Percentage (%) Amount of cumulative Ad Mediation + IAP Revenue (total revenue N days after install - spend) divided by spend |
| UA | Lifetime All ROI (Ad Network + IAP) | Lifetime All ROI (Ad Network + IAP) | Average Lifetime ROI (Ad Network + IAP) Percentage (%) |
| UA | Lifetime All ROAS (Ad Network + IAP) | Lifetime All ROAS (Ad Network + IAP) | Average Lifetime All ROAS Percentage (%) |
| UA | Lifetime All ROI (Ad Mediation + IAP) | Lifetime All ROI (Ad Mediation + IAP) | Lifetime All ROI (Ad Mediation + IAP) |
| UA | Lifetime All ROAS (Ad Mediation + IAP) | Lifetime All ROAS (Ad Mediation + IAP) | Lifetime All ROAS (Ad Mediation + IAP) |
| UA | N-Day All pLTV (Ad Mediation + IAP) | N-Day All pLTV (Ad Mediation + IAP) | Cumulative predicted revenue (IAP + Ad Mediation Revenue) N-Days after install (Currently up to 30-Days cohorts supported) |
| UA | N-Day All pROAS (Ad Mediation + IAP) | N-Day All pROAS (Ad Mediation + IAP) | Average N-Day Predicted ROAS Percentage (%) Amount of cumulative All pLTV (Ad Mediation + IAP) N days after install divided by spend (Currently up to 30-Days cohorts supported) |
| UA | N-Day All pROI (Ad Mediation + IAP) | N-Day All pROI (Ad Mediation + IAP) | Average N-Day Predicted ROI Percentage (%) Amount of cumulative (All pLTV (Ad Mediation + IAP) N days after install - spend) divided by spend (Currently up to 30-Days cohorts supported) |
| UA | All Profit Margin (Ad Mediation + IAP) | All Profit Margin (Ad Mediation + IAP) | All Revenue (Ad Mediation + IAP) - Spend |
| UA | All Profit Margin (Ad Network + IAP) | All Profit Margin (Ad Network + IAP) | All Revenue (Ad Network + IAP) - Spend |
| UA | DAU | Daily Active Users | Number of unique users (advertising_id) per day |
| UA | N-Day Users | N-Day Retained Users | Total number of users retained after N-Day of installing the app |
| UA | Lifetime Ret | Lifetime Retention | Cohorted N-day Retention Rate |
| UA | N-Day Ret % | N-Day Retention Rate | Average N-Day Retention Rate Percentage (%) |
| UA | Total Fraud Events | Total Fraud Events | Sum of blocked clicks and fradulent purchases |
| UA | Blocked Clicks | Blocked Clicks | The number of clicks we blocked based on mean time to install(MTTI). We currently use 1 second for the MTTI threshold as default. |
| UA | Blocked Device Events | Blocked Device Events | Number of test device events |
| UA | Fradulent Purchases | Fraudulent Purchases | Number of purchases marked as fradulent |
| UA | Blocked Fradulent Rev | Blocked Fraudulent Revenue | Total Blocked Fraudulent Revenue Amount ($) |
| UA | Reported Clicks | Reported Clicks | Number of times the ad was clicked reported by Ad Networks |
| UA | Clicks Diff | Clicks Difference | Total Clicks Difference. Formula : Reported Clicks - Tracked Clicks |
| UA | Clicks Difference Percent | Clicks Difference Percent | Average Clicks Difference Percentage (%) Formula : 100 - 100 * Tracked Clicks / Reported Clicks |
| UA | Lifetime Cost / User | Lifetime Cost per Retained User | Cohorted cost per N-day Retained User |
| UA | CPC | Cost-Per-Click (CPC) | Average CPC Amount ($) spend/reported clicks |
| UA | CPI | Cost-Per-Install (CPI) | Average CPI Amount ($) spend/reported installs |
| UA | CPM | Cost-Per-1000-Impressions (CPM) | Average CPM Amount ($) 1000 * spend/reported impressions |
| UA | CPR | Completion Rate (CPR) | Average CPR Percentage (%) 100 * reported installs / reported impressions |
| UA | CTR | Click-Through-Rate (CTR) | Average CTR Percentage (%) 100* reported clicks / reported impressions |
| UA | CVR | Conversion Rate (CVR) | Average CVR Percentage (%) 100 * reported installs / reported clicks |
| UA | Impressions | Reported Impressions | Number of times your ad was displayed |
| UA | Reported Installs | Reported Installs | Number of installs reported by Ad Networks |
| UA | Installs Diff | Installs Difference | Total Installs Difference. Reported Installs - Tracked Installs |
| UA | Installs Difference Percent | Installs Difference Percent | Average Installs Difference Percentage (%). 100 - 100 * Tracked Installs / Reported Installs |
| UA | Impressions (Ad Mediation) | Total impressions in the given time period | Total impressions in the given time period |
| UA | IMPDAU (Ad Mediation) | Average impressions per user in the given time period | Total Impressions divided by Total Daily Active Users |
| UA | Lifetime Active Days / User | Lifetime Active Days Per User | Average number of active days for a user |
| UA | Sessions | Sessions | Average Sessions |
| UA | Lifetime Sess / User | Lifetime Sessions Per User | Average Sessions per User |
| UA | Spend | Spend | Amount spent to acquire users (in USD) |
| UA | tCPI | Cost-Per-Tracked Install (tCPI) | Average tCPI Amount ($) spend / tracked installs |
| UA | Tracked Clicks | Tracked Clicks | Number of times your ad was clicked (Tenjin tracked) |
| UA | Tracked CVR | Tracked Conversion Rate (CVR) | Average CVR Percentage (%) 100 * tracked installs / tracked clicks |
| UA | Tracked Impressions | Tracked Impressions | Number of impressions tracked by Tenjin |
| UA | Tracked Installs | Tracked Installs | Number of Installs tracked by Tenjin |
| UA | Tracked Reinstalls | Tracked Reinstalls | Number of Reinstalls tracked by Tenjin |
| UA | CP N-Day User | Cost per N-Day Retained User | Cost per users that comes back N days after install (installs here are reported by the ad network). Formula - spend * (users_0d/reported installs) / users_Nd |
| UA | N-Day Sess | N-Day Sessions | Number of times an app was opened after post install on the day of install (N day) |
| UA | CP K N-Day Sessions | Cost per 1000 N-Day Sessions | Average Cost per 1000 N-Day Sessions Amount ($) |
| UA | Purchasers | Unique Purchasers | Number of the unique purchasers |
| UA | Transactions | Purchase Transactions | Number of the total purchase counts |
| UA | N-Day Cost / Purchase | N-Day Cost Per Purchase Transactions | Cost divided by cumulative total purchase counts N days after the install |
| UA | N-Day Cost / Purchaser | N-Day Cost Per Returning Purchaser | Cost divided by returning purchase user N days after the install |
| UA | N-Day Cumul Revenue | N-Day Cumulative Purchase Revenue | Cumulative purchase revenue N days after the install |
| UA | N-Day Revenue / User | N-Day Cumulative Purchase Revenue per Acquired User | Cumulative purchase revenue N days after the install, divided by the number of acquired users |
| UA | N-Day Cumul Txns | N-Day Cumulative Purchase Transactions | Cumulative purchase counts N days after the install |
| UA | N-Day Txns per User | N-Day Cumulative Purchase Transactions per Acquired User | Cumulative purchase counts N days after the install, divided by the number of acquired users |
| UA | N-Day Participation | N-Day Purchaser Participation | Percent of unique purchasers N days after the install out of the number of acquired users |
| UA | N-Day Purchasers | N-Day Unique Purchasers | Cumulative unique purchasers N days after the install |
| UA | Average | Average Purchase Value per Transaction | Total purchase revenue, divided by total purchase counts |
| UA | Revenue | Purchase Revenue | Total purchase revenue |
Ad Monetization Metrics
| report type | abbreviated name | full name | description |
|---|---|---|---|
| AM | Reported Ad Revenue | Reported Ad Revenue | Total Ad Revenue reported by Ad Network ($) |
| AM | eCPC | Effective Cost per Click (eCPC) | Ad Revenue per Click ($) |
| AM | eCPM | Effective Cost per Mille (eCPM) | Ad Revenue per 1000 Impressions ($) |
| AM | Reported Clicks | Reported Clicks | Total Clicks reported by Ad Network |
| AM | Impressions | Reported Impressions | Total Impressions reported by Ad Network |
SKAdnetwork Metrics
| report type | abbreviated name | full name | description |
|---|---|---|---|
| SKAN | Conversions | Conversions | Number of Conversion postbacks forwarded by Ad Networks (includes redownloads and first downloads) |
| SKAN | Conversion Value Average | Conversion Value Average | Average of Conversion Values forwarded by Ad Networks (includes redownloads and first downloads) |
| SKAN | Conversion Value Total | Conversion Value Total | Sum of Conversion Values forwarded by Ad Networks (includes redownloads and first downloads) |
| SKAN | Ad Network SKAN Installs | Ad Network SKAN Installs | Number of Conversion postbacks received for first downloads forwarded by Ad Networks |
| SKAN | First Download CV Avg | First Download Conversion Value Average | Average Conversion Value for first downloads forwarded by Ad Networks |
| SKAN | First Download CV Total | First Download Conversion Value Total | Sum of Conversion Values for first downloads forwarded by Ad Networks |
| SKAN | Redownloads | Redownloads | Number of Conversion postbacks received for redownloads forwarded by Ad Networks |
| SKAN | Redownload CV Avg | Redownload Conversion Value Average | Average Conversion Value for redownloads forwarded by Ad Networks |
| SKAN | Redownload CV Total | Redownload Conversion Value Total | Sum of Conversion Values for redownloads forwarded by Ad Networks (includes redownloads and first downloads) |
| SKAN | Assists | Assists | Ad network forwarded ad impressions that were shown to a user that ultimately downloaded the app, but were not awarded with an attribution. Introduced in SKAdNetwork 3.0, this corresponds to postbacks with did-win=false. |
| SKAN | Redownload Assists | Redownload Assists | Number of Assist postbacks received for redownloads forwarded by Ad Networks |
| SKAN | First Download Assists | First Download Assists | Number of Assist postbacks received for first downloads forwarded by Ad Networks |
| SKAN | Apple Conversions | Apple Conversions | Number of Conversion postbacks forwarded by Apple (includes redownloads and first downloads) |
| SKAN | Apple Conversion Value Average | Apple Conversion Value Average | Average of Conversion Values forwarded by Apple (includes redownloads and first downloads) |
| SKAN | Apple Conversion Value Total | Apple Conversion Value Total | Sum of Conversion Values forwarded by Apple |
| SKAN | Apple SKAN Installs | Apple SKAN Installs | Number of Conversion postbacks received for first downloads forwarded by Apple |
| SKAN | Apple First Download CV Avg | Apple First Download CV Avg | Average Conversion Value for first downloads forwarded by Apple |
| SKAN | Apple First Download CV Total | Apple First Download CV Total | Sum of Conversion Values for first downloads forwarded by Apple |
| SKAN | Apple Redownloads | Apple Redownloads | Number of Conversion postbacks received for redownloads forwarded by Apple |
| SKAN | Apple Redownload CV Avg | Apple Redownload CV Avg | Average Conversion Value for redownloads forwarded by Apple |
| SKAN | Apple Redownload CV Total | Apple Redownload Conversion Value Total | Sum of Conversion Values for redownloads forwarded by Apple |
| SKAN | Apple Assists | Apple Assists | Apple forwarded ad impressions that were shown to a user that ultimately downloaded the app, but were not awarded with an attribution. Introduced in SKAdNetwork 3.0, this corresponds to postbacks with did-win=false. |
| SKAN | Apple Redownload Assists | Apple Redownload Assists | Number of Assist postbacks received for redownloads forwarded by Apple |
| SKAN | Apple First Download Assists | Apple First Download Assists | Number of Assist postbacks received for first downloads forwarded by Apple |
- report type:
- UA: User Acquistion
- AM: Ad Monetization
- SKAN: SKAdNetwork
All N-Day metrics are cohorted metrics and grouped by Acquisition Date. All other non-cohorted metrics are grouped by calendar date. Details below.
Common cohorts in the Tenjin dashboard
Show more
Since a set of users can be defined as a cohort, Tenjin's dashboard looks at the most common cohorts to analyze marketing data.
Here are the following common cohorts that marketers usually want to understand:
-
Acquisition date - segmenting and grouping users by acquisition date is one of the most important things app marketers do. It allows marketers to calculate metrics like x-Day retention and x-Day LTV.
-
User dimensions - segmenting and grouping users by channel, campaign, country, and creative allows marketers to see metrics on different dimensions. Analyzing users by these dimensions reveals insights about which users want your app and which ones don't.
For all custom cohort analyses and optimizations, DataVault is a powerful tool that can provide these insights. DataVault marketers build custom cohorts based on various dimensions and metrics that are only accessible with raw data. As an example, downloading advertising_id level data allows marketers to build lookalike audiences for continuous campaign optimization.