How to analyze “Usage” in the User Acquisition Report
We also have a dedicated “Usage” view in the User Acquisition Report. With this view, you can analyze the Usage of your apps by looking at metrics such as Tracked Installs, Daily Active Users and Sessions data. Analyzing your usage allows you to gain insights into how many users have been acquired from your app over a given period of time.
How can you access the “Usage” view in the User Acquisition Report?
You can access this view by going into ANALYZE → User Acquisition tab and choosing Usage from the drop down menu.
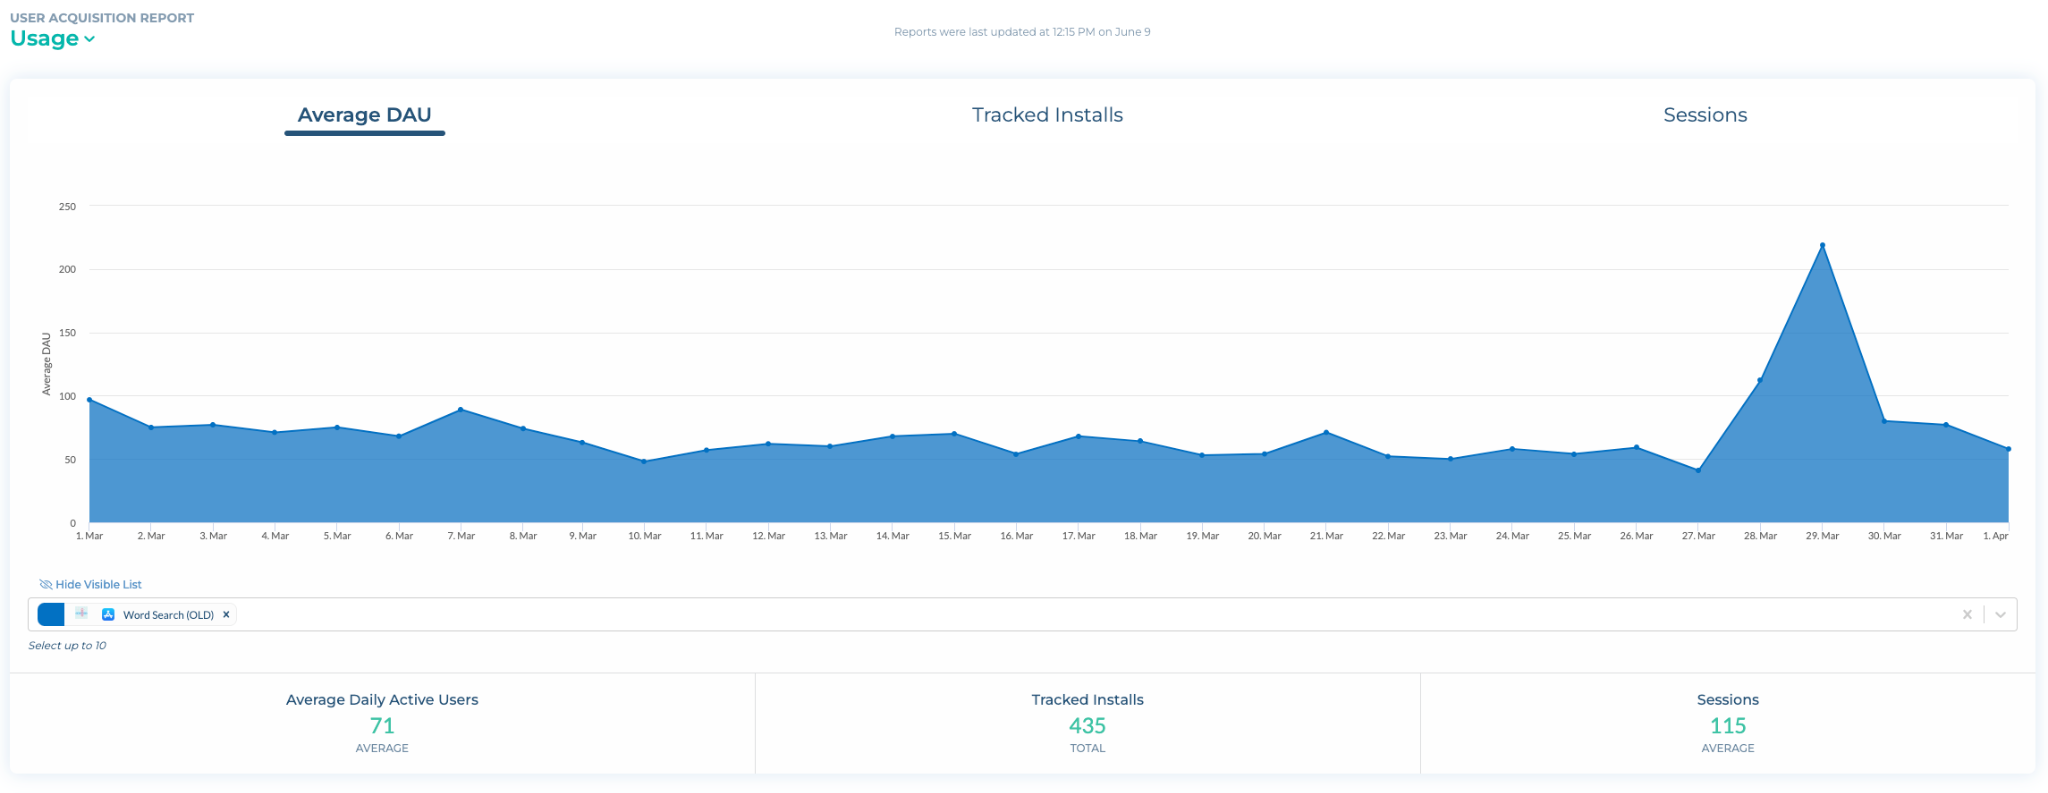
With the graphs in the “Usage” view you can look at the “Average DAU,” “Tracked Installs,” and “Sessions” cohorted over the lifetime of the users.
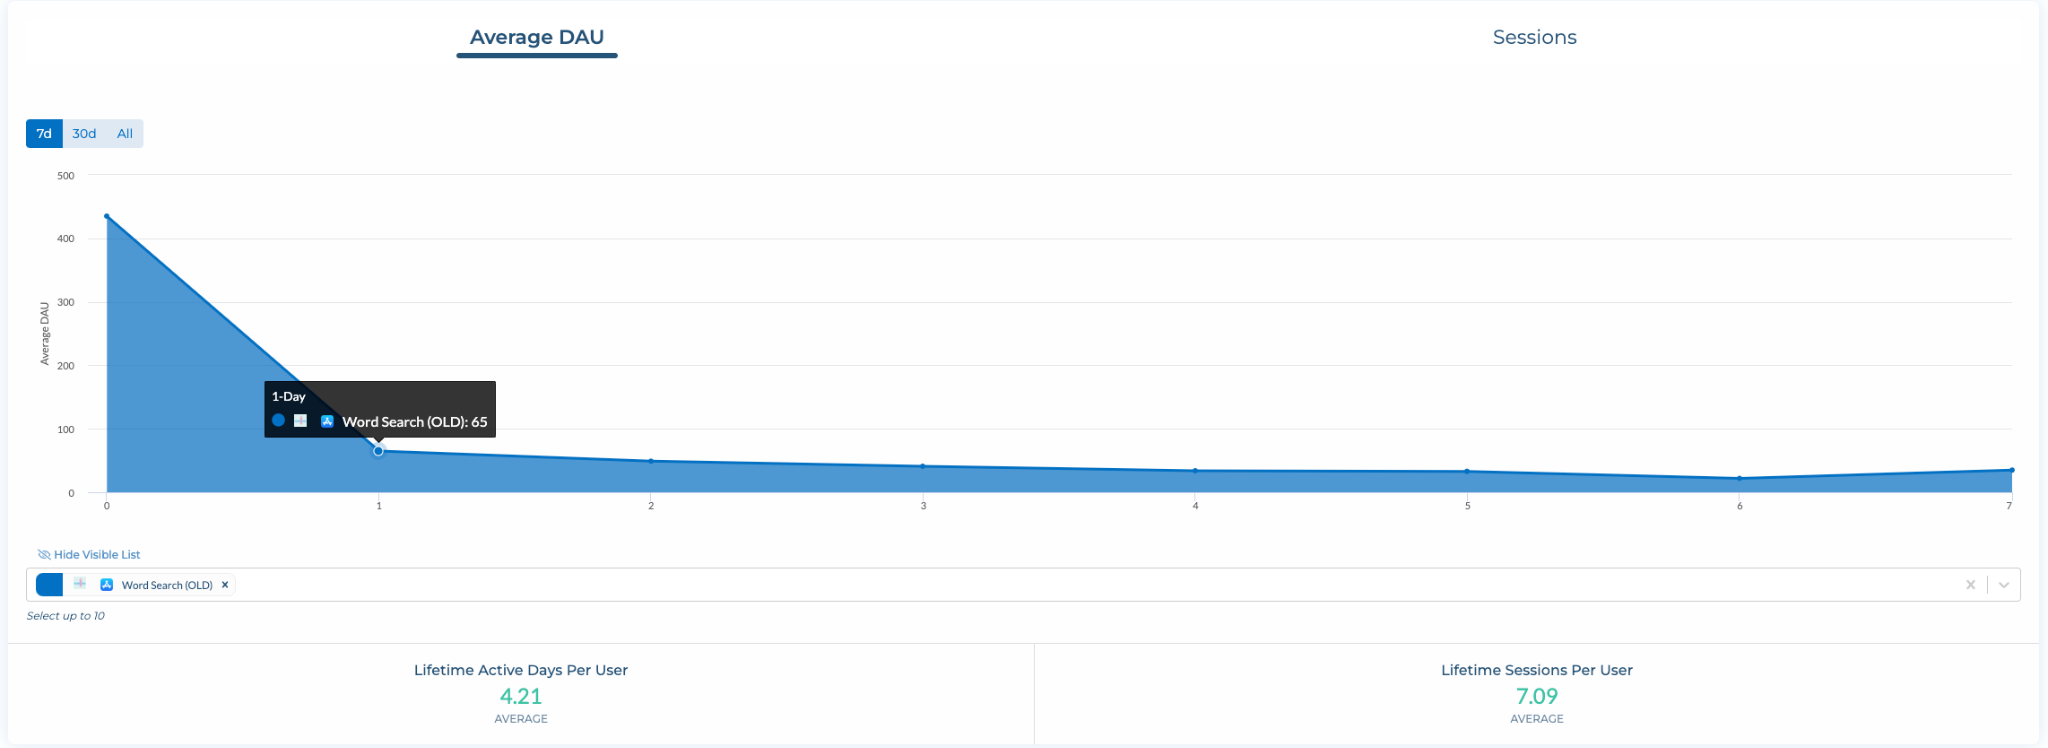
You will also have access to Lifetime Active Days Per User in this tab, that allows you to understand retention and engagement of your users.