How to analyze “ROI” in the User Acquisition Report
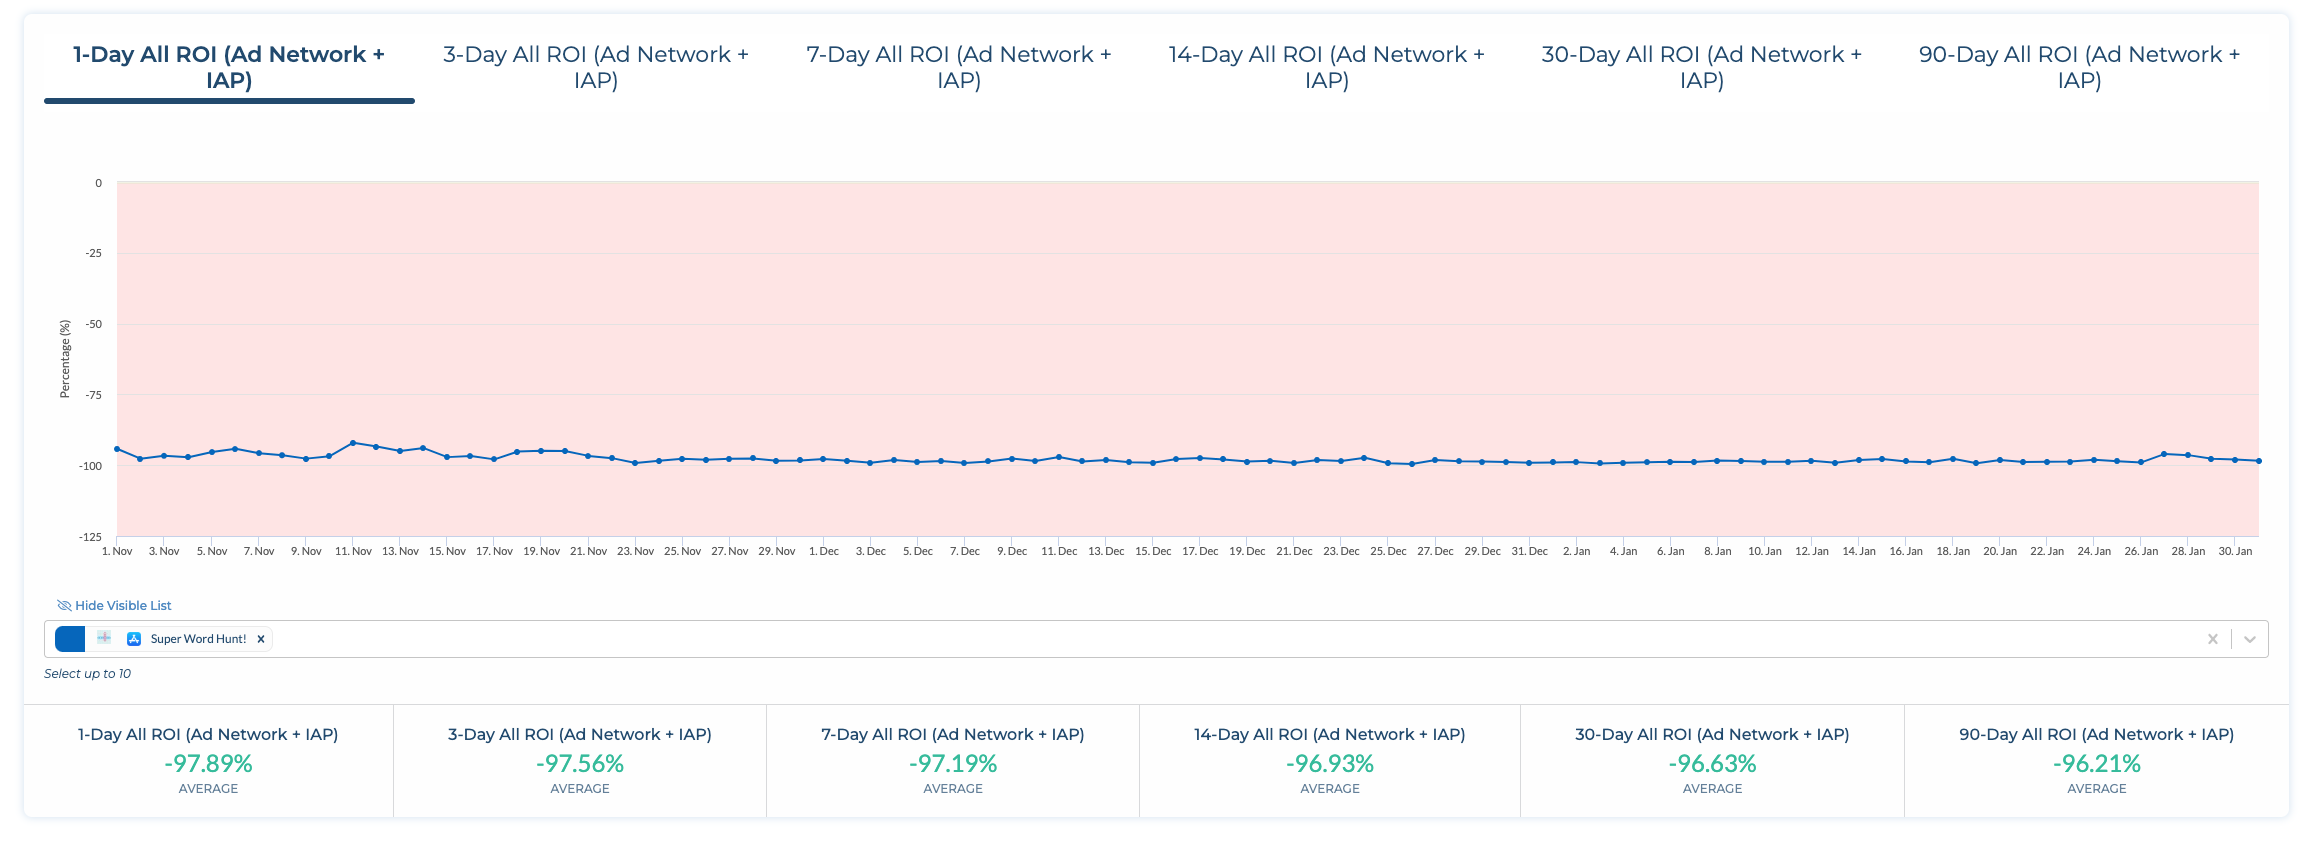
With this view, you can analyze the cohorted N-Day ROI as the amount of cumulative total profit (total revenue N days after install - spend) divided by spend.
How can you access the “ROI” view in the User Acquisition Report?
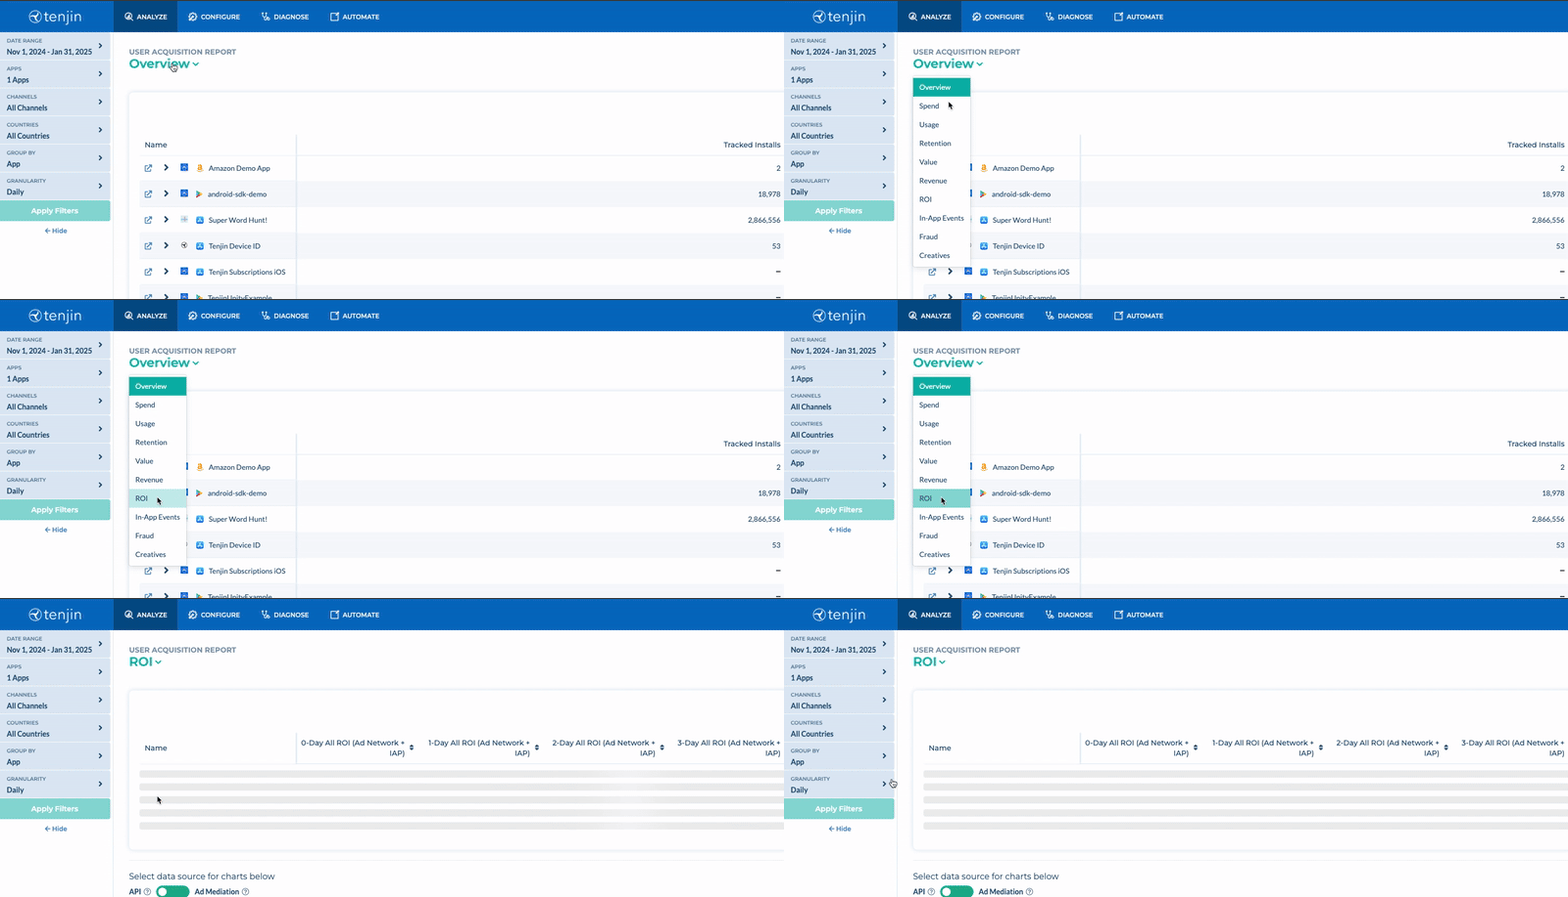
You can access this view by going into ANALYZE → User Acquisition tab and choosing ROI from the drop down menu.

What metrics can you access in the “ROI” view in the User Acquisition Report?
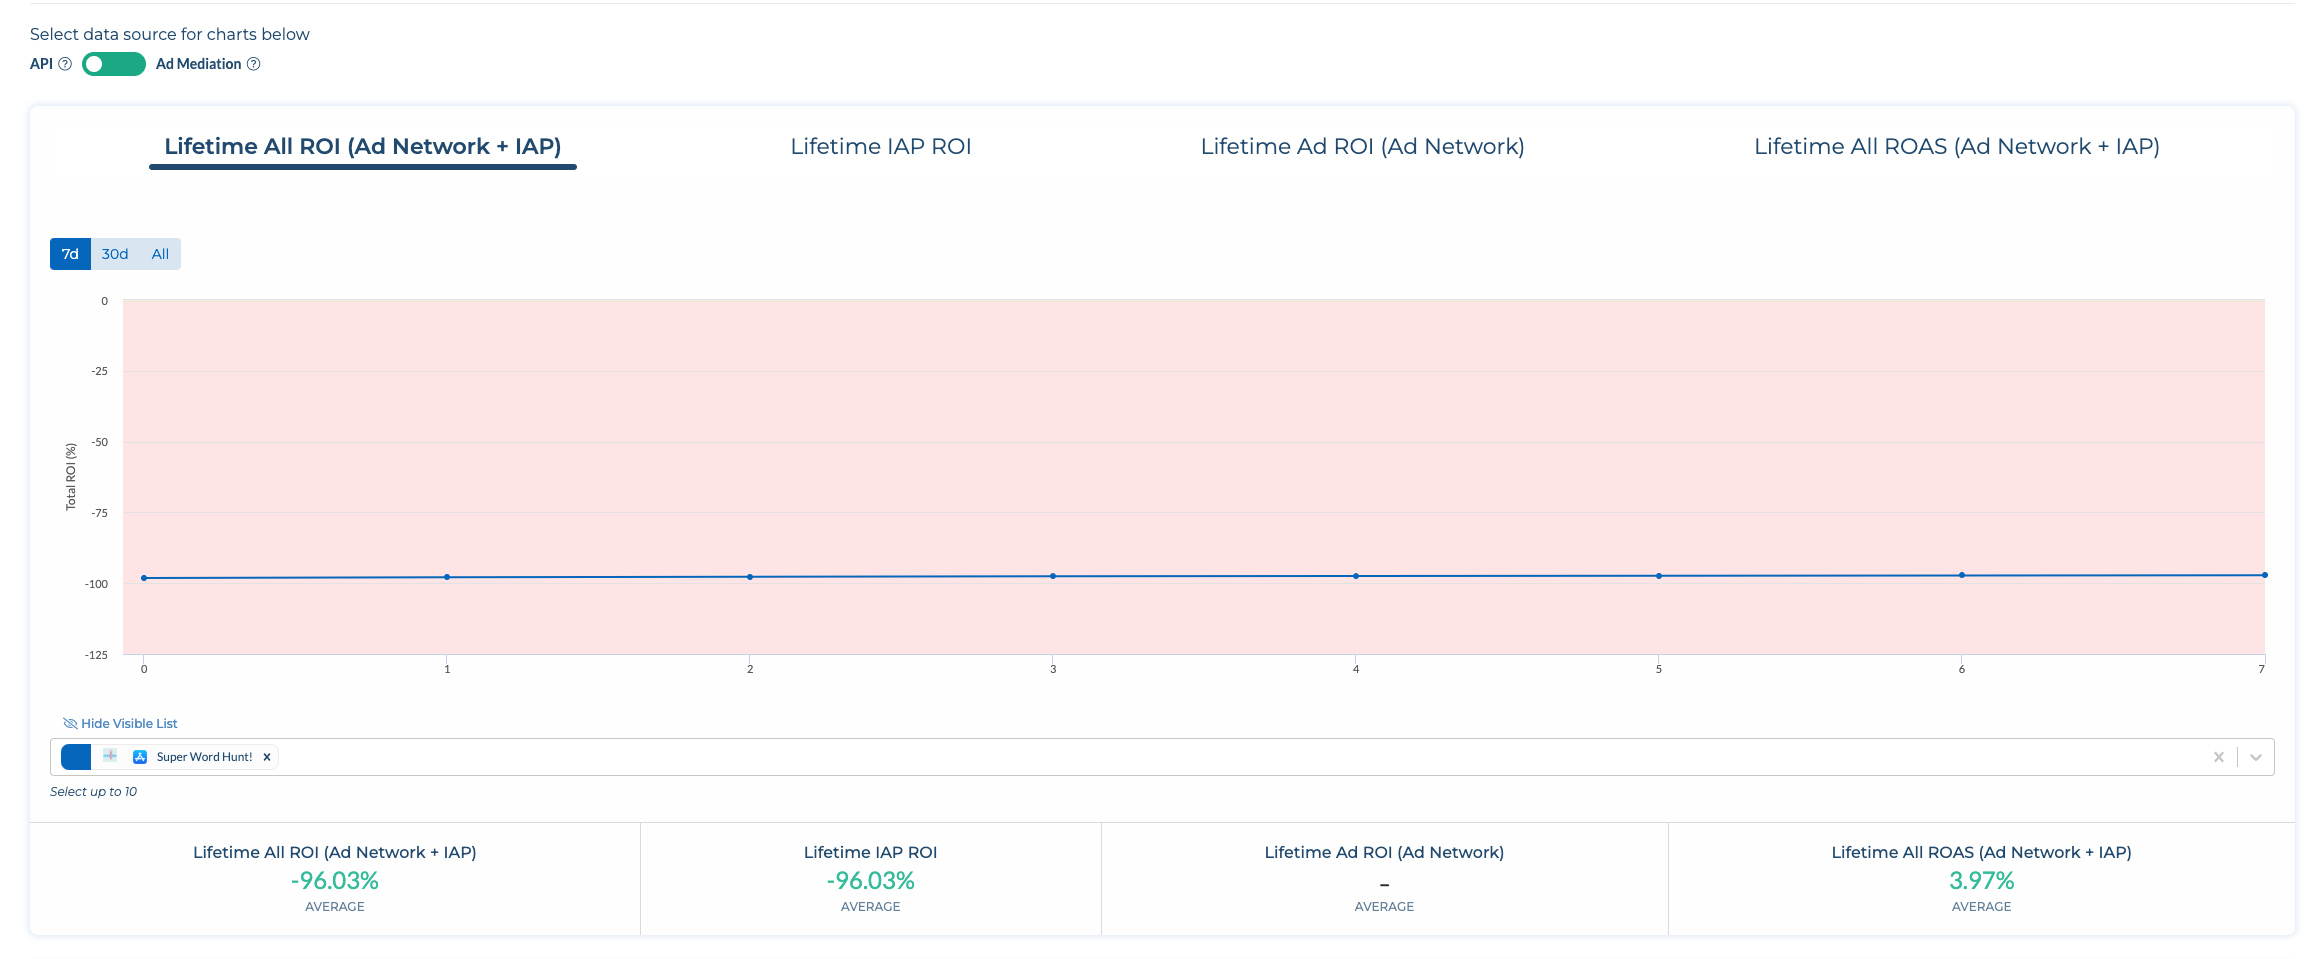
Different charts and graphs can be accessed to understand the lifetime ROI for your campaigns under this tab. We generate this for Lifetime IAP ROI and Lifetime Ad Revenue ROI separately as well.

Analyzing ROI helps to determine the efficiency of your marketing campaigns, and serves as a guide when deciding what type of bid optimizations you should incorporate.These charts help you visualize your N-Day ROI over the selected time range and give a clearer picture of how much profit are you generating for your campaigns.
