Types of Metrics
Tenjin allows you to analyze 4 different types of metrics: date range metrics, time series metrics, drill down table with metrics, and acquisition date cohorts and x-Day metrics.
1. Date range metrics
Show more
These metrics can be found in various places in the dashboard.
These metrics can be found in various places in the dashboard. Most notably on the "Overview" pages and under time series and x-Day cohort charts. Below are some examples of date range metrics.
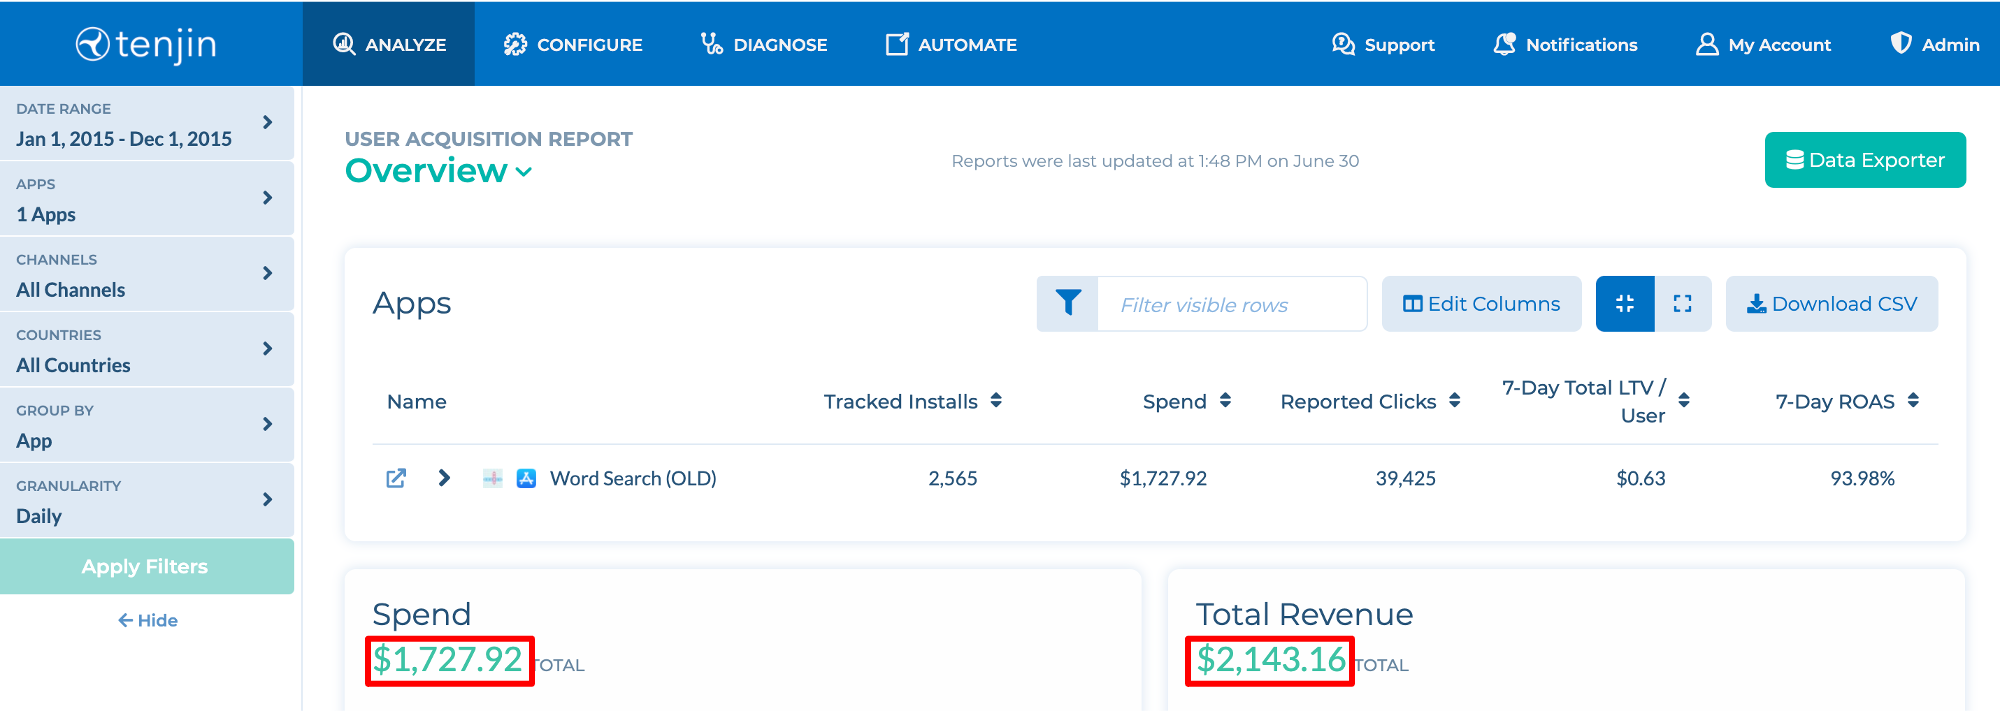
In the above you can see summary metrics for "Total Spend", "Total Revenue", "DAU", and "Tracked Installs" over the date range January 1, 2015 - December 1, 2015.
2. Time series metrics
Show more
Time series analyses show how a specific metric changes for a specific user cohort over time. Below you can see how Daily Active Users (DAU), for each marketing channel, and changes each day over a date range.
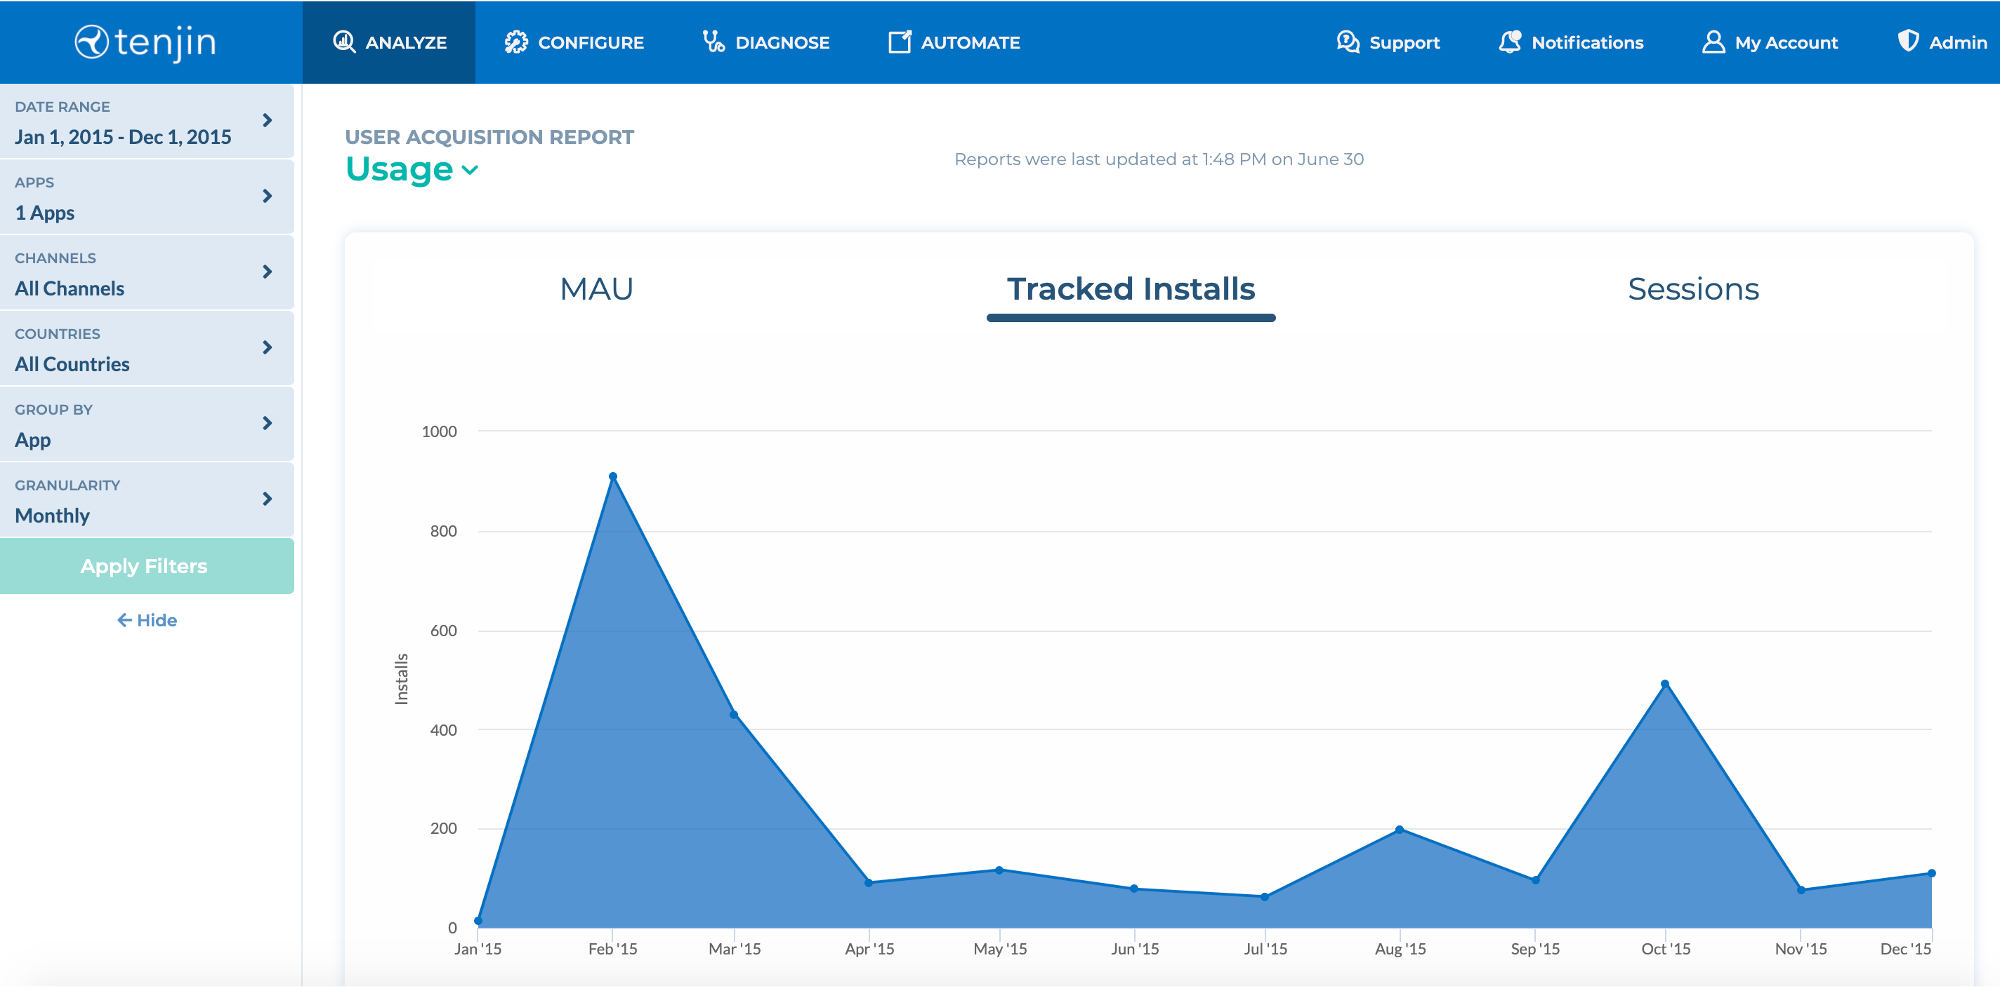
This is important for quickly identifying trends on metrics and cohorts of interest by marketers. The charts show the top 10 variables of a series at a time. You can edit the filters to choose other variables, or exclude a series (based on your grouping) from the charts.
3. Drill down table with metrics
Show more
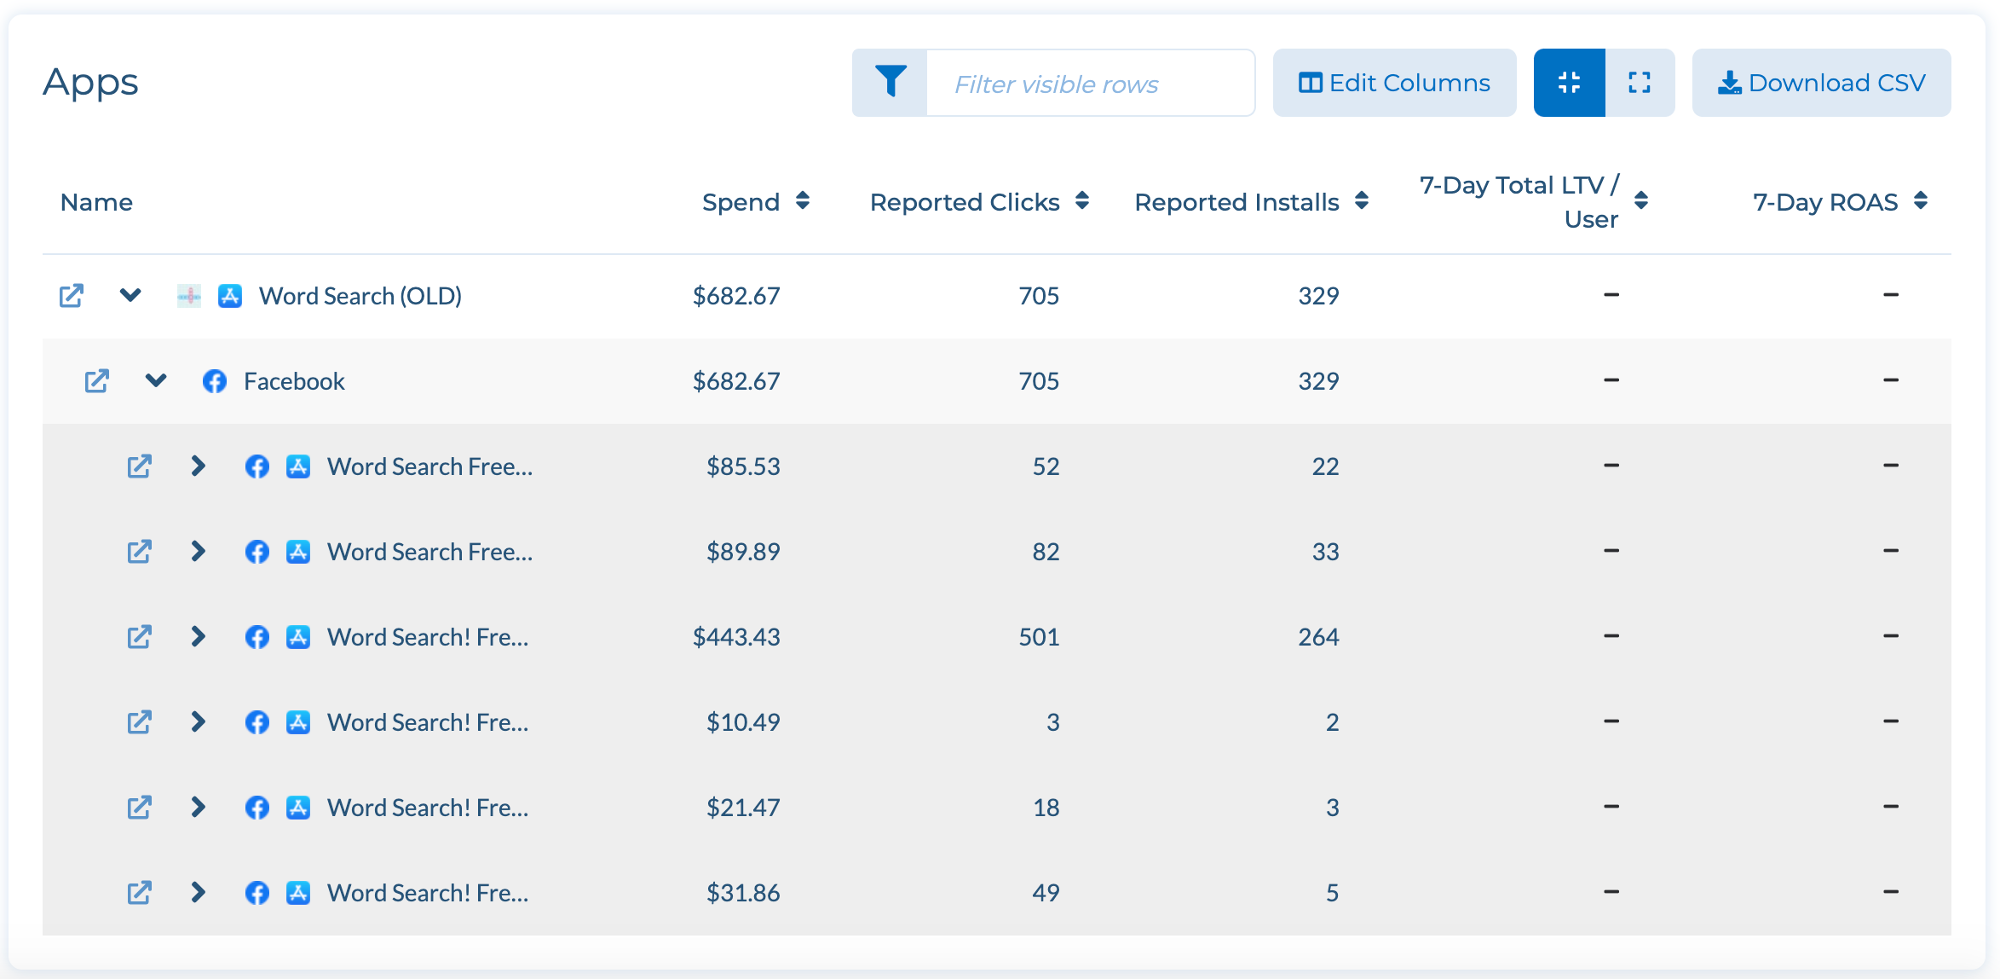
Drill down tables are multiple date range metrics that allow you to look at different segments of users at the same time.

In the example above you can see multiple user segment "layers" of this specific drill down. App -> Ad Network -> Campaign and the subsequent date range metrics that are associated with each of those user segments.
The way this is read is "users for a specific app, ad network, and campaign have [x number] of [specific metric]." In this case you could say "The marketer spent $357.94 on Facebook for the dates between 1/1/17 - 12/31/17 on the Word Search app in the App Installs(US - 18+) campaign."
Customizing drill down table metric
Tenjin drill down analyses support customization of metrics to look at. You can enable this by clicking the Edit Metrics button and selecting the metrics to view.
You can see a list of metrics that are currently shown on the dashboard in SELECTED METRICS, and that you can add additionally to the dashboard in AVAILABLE METRICS. You can also change the order of selected metrics by drag and drop.
Then you'll need to click Apply Metrics.
These selected metrics are saved once you set them up, so no need to change them every time you login.
Exporting drill down metrics
Show more
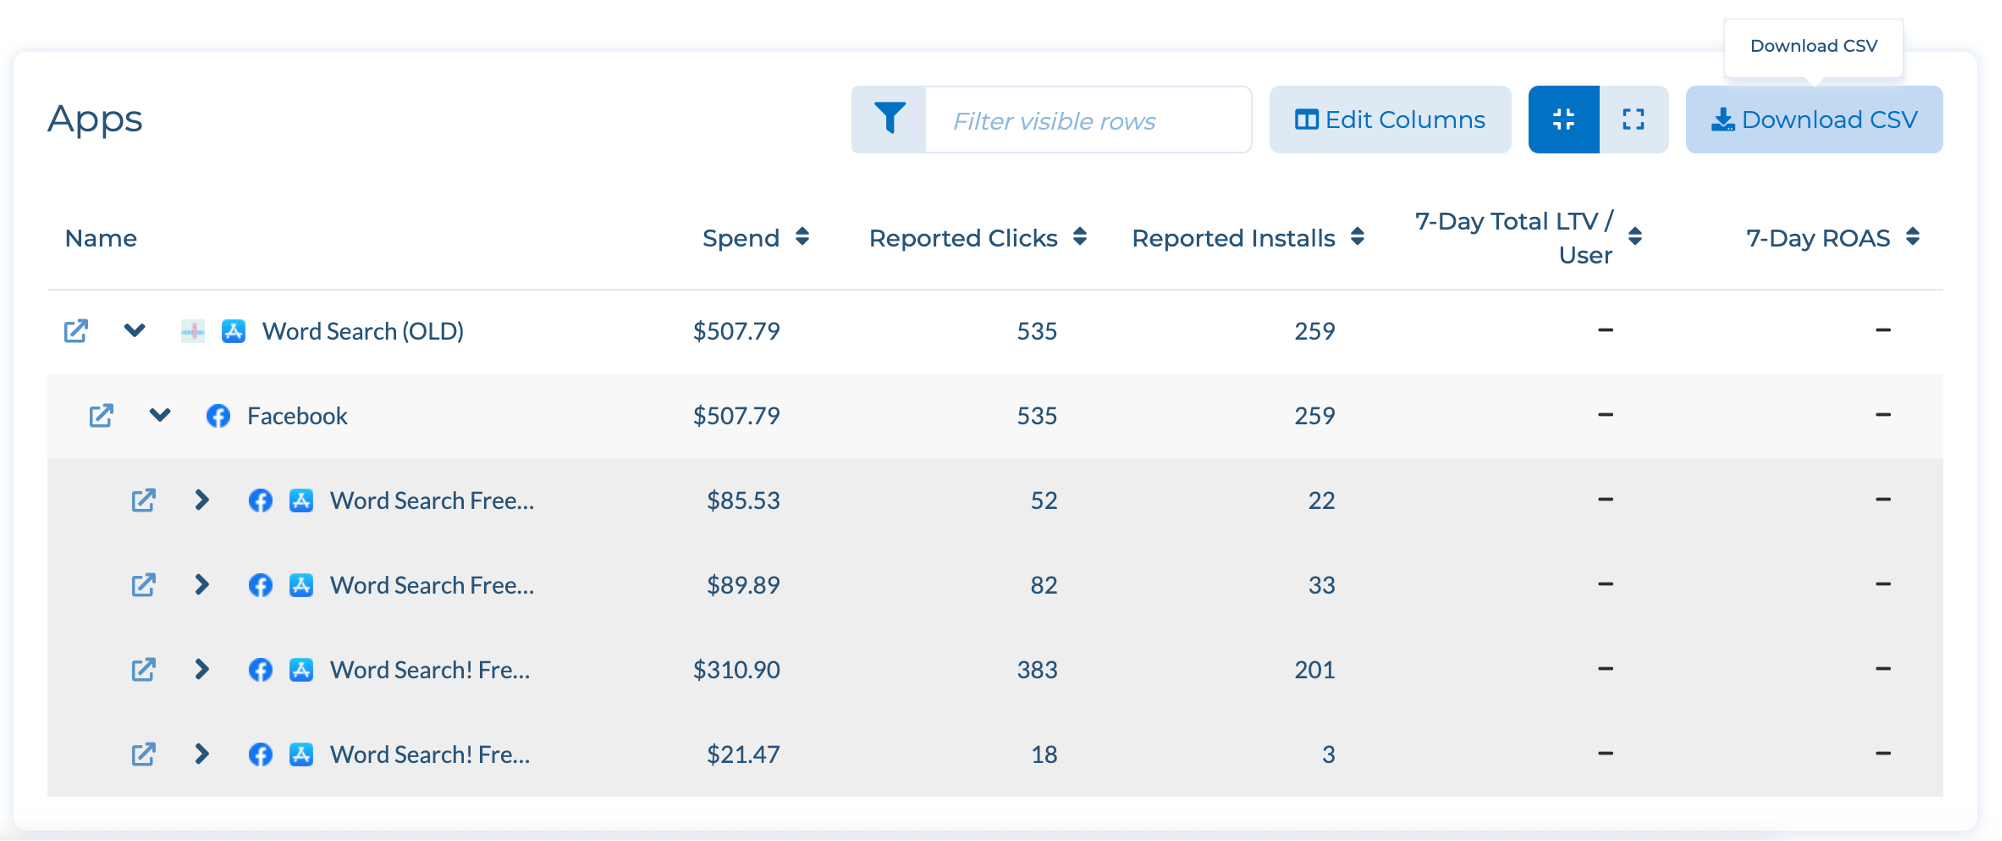
If you want to export the drill down data to a CSV file, you can click the "Download CSV" button. The CSV only contains the data chosen by the app filter and group by options on the left side.
4. Acquisition date cohorts and x-Day metrics
An acquisition date cohort is a group of users that were acquired on a specific date. There are a couple ways to view this concept in Tenjin.
Daily cohort view
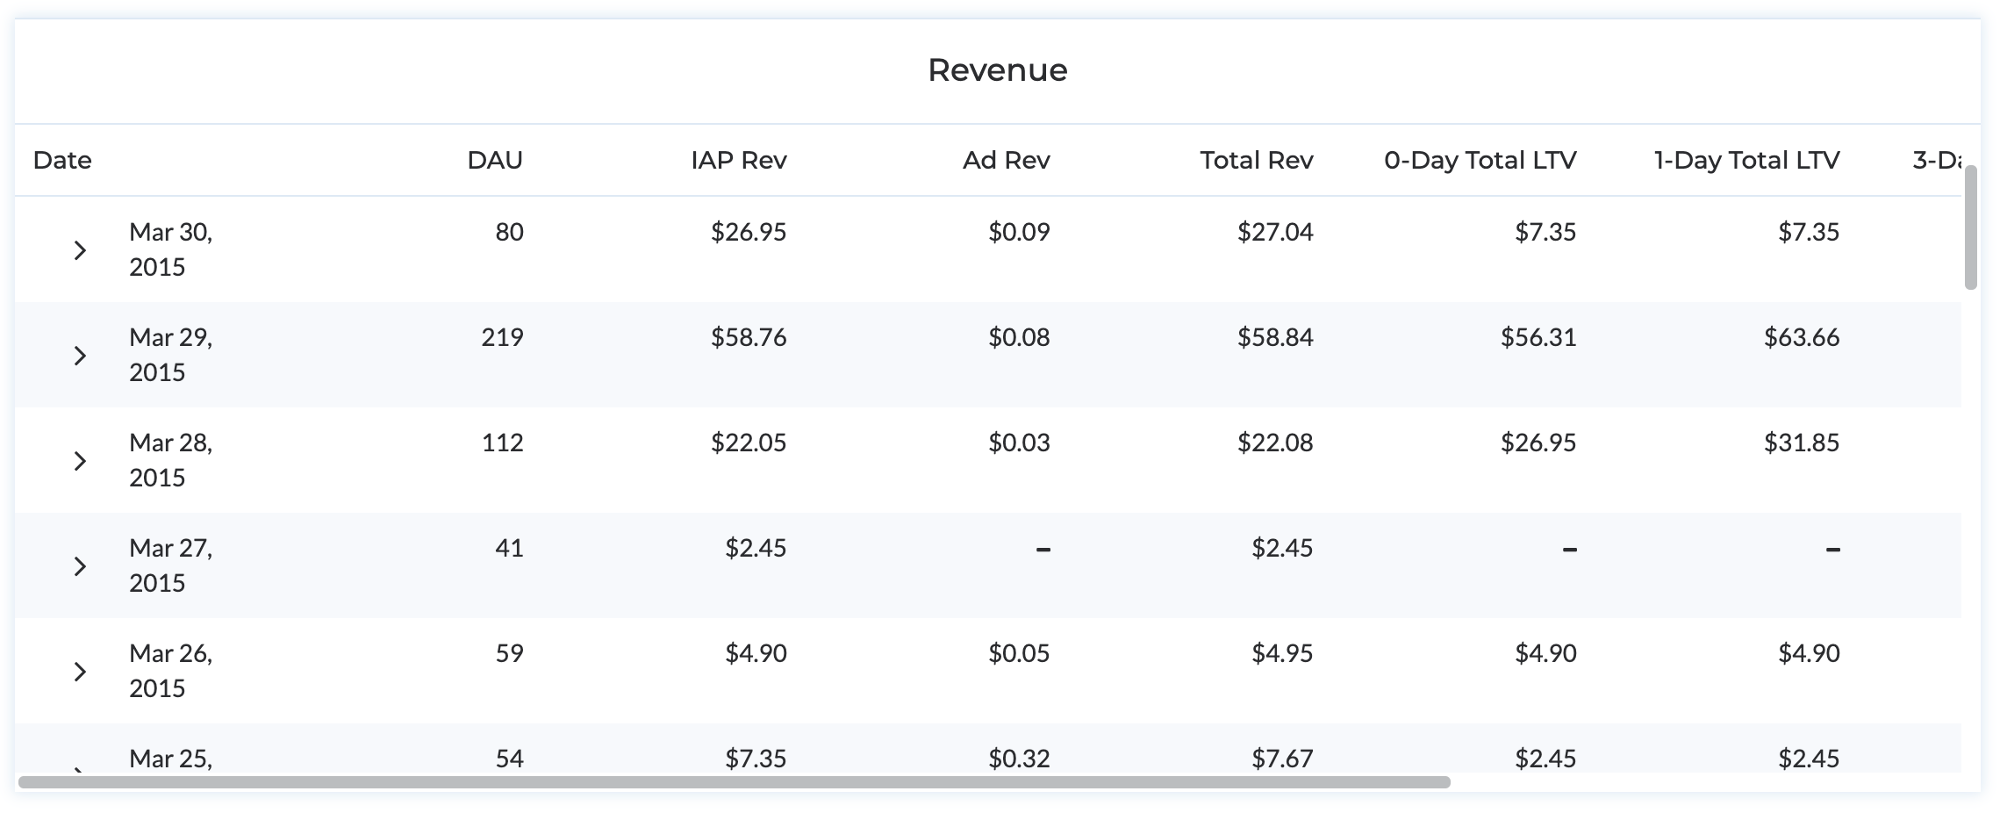
As an example of how to read this, you can see in the above the users that came in on 3/29/2015, in total, generated $85.71 90-days after the install date.
This analysis can show any metric for a date range where all metrics analyze only the users that were acquired on a specific date.
Average daily cohort view
The average daily cohort analysis spans a date range of acquisition dates. Using any x-day metric, each acquisition date in the date range contains 0 through 90 day values for each acquisition cohort. The following shows you the average x-day retention for an app across all acquisition date values in the date range.
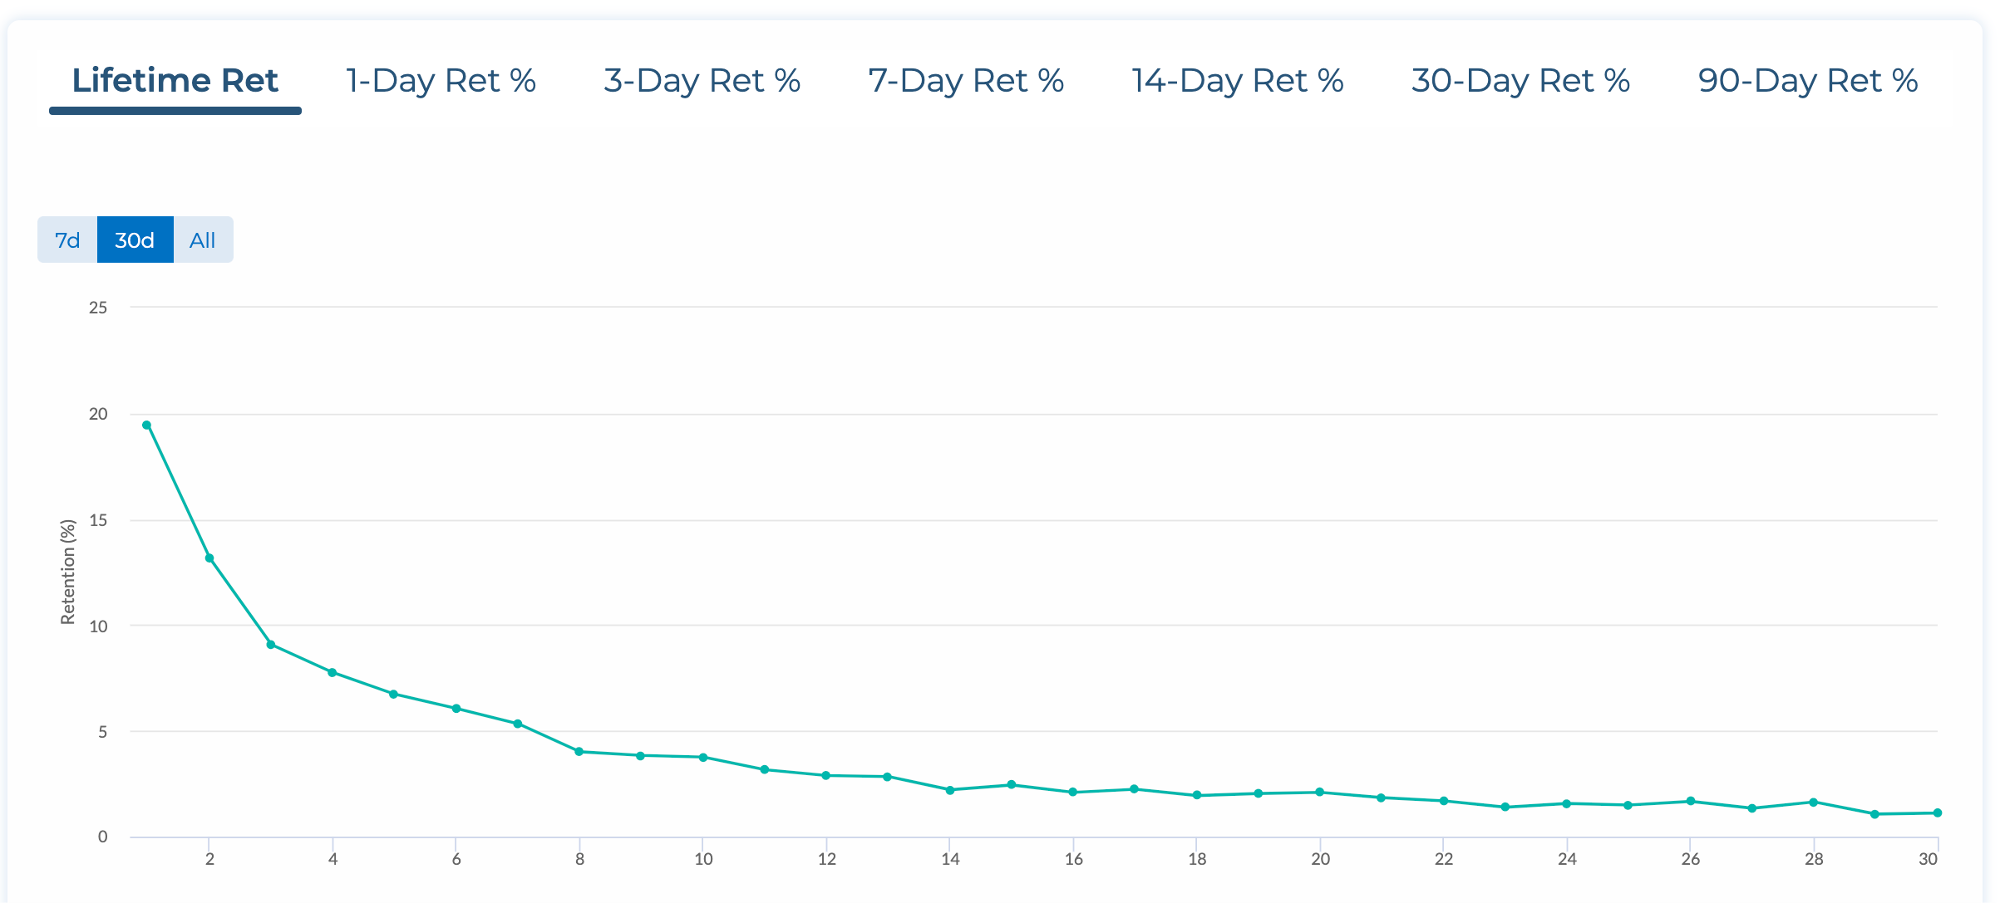
The 0-day value shown above is the "average" of all the 0-day retention values for each acquisition date cohort in the date range for this app.